Should we fear a replay of the 1970’s High-Inflation era?
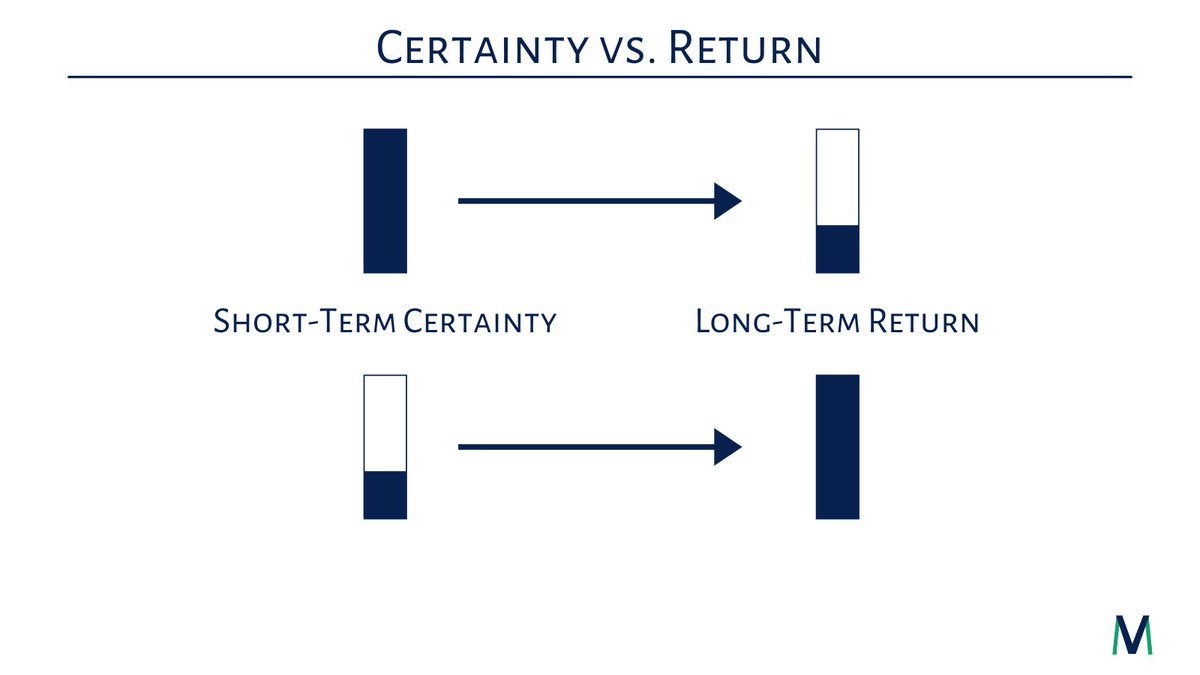
Today’s jobs report points to an unemployment rate of 3.7% – the lowest since 1969, the year when the worst outbreak of inflation began to be felt. From 1969 to 1982 inflation spiked to 7.3% annually and wrecked stock and bond returns – which were negative in real terms. Though there are parallels, a deeper dive today points to a very different picture relative to ‘69.
Like the late 60s we are now in the middle of a big fiscal stimulus via tax cuts, higher social spending, and a big jump in defense spending. We also have begun to see a move higher in interest rates to 3% on the 10-Year Treasury; but once again, from a very low base of 2%. And while the labor market has tightened the inflation rate today remains at 2.2% – which is on the low end of its historical range.
The ingredients for 70s-type inflation are simply not present: the bargaining power of US workers is a shadow of what it was, we are now a net exporter of energy, and the Fed is perceived to be independent and free to raise rates even at political cost to the White House. (not the case under Nixon.)
Through global supply chains, outsourcing, and technology corporate America has been able to dramatically contain labor costs – easily their single biggest expense item; and as a result the profit margins underpinning the S&P500 give us the confidence that our clients’ stock/bond portfolios can handle, and even benefit from a gradual shift to a normal inflation level of 3-4% – similar to the 90s.
Bond Vigilantes demand higher rates
Through the 50s and 60s US bond investors provided a steady supply of low-cost credit to the US Treasury. Strong growth averaging 7% and a low borrowing cost (3%) combined to bring our National Debt down from 109% of GDP in ‘47 to 28% by ‘70, putting to bed any fears of default. Yet by 1970 the Treasury’s borrowing cost had almost doubled to 5.4% and to 9% from 1970-1985:
| National Debt In current Dollars (billions) | |||
| National Debt | Interest Paid | Annual % Borrowing Cost | |
| 1950 | 219 | 4.8 | 2.2% |
| 1955 | 226 | 5.2 | 2.3% |
| 1960 | 237 | 7.8 | 3.3% |
| 1965 | 261 | 9.6 | 3.7% |
| 1970 | 283 | 15.4 | 5.4% |
| 1975 | 395 | 25.0 | 6.3% |
| 1980 | 712 | 62.8 | 8.8% |
| 1985 | 1,507 | 152.9 | 10.1% |
| 1990 | 2,412 | 202.4 | 8.4% |
| 1995 | 3,604 | 239.2 | 6.6% |
| 2000 | 3,410 | 232.8 | 6.8% |
The bond market’s concern was not default. Despite deficits to fund ‘Great Society’ programs AND the Vietnam war our debt-to-GDP stayed below 30% until ‘84; yet even so Treasury’s borrowing cost spiked.
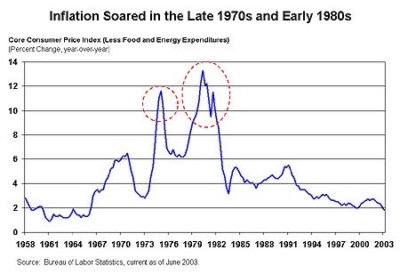
By 1969 inflation had broken out of its historical sub-3% range. Big buyers of US Treasuries – banks, insurance companies, and pension funds – came to believe that the Fed, who was slow to tighten the money supply – had lost its will to preserve the purchasing power of the dollar. The cost of living – as measured by the Consumer Price Index (CPI) – began a multi-year march higher from 3% to 13% by ‘79.
To induce banks to lock up their money at a fixed rate for 3,7, or 10 year terms – with prices of everything inflating at a never-before-seen pace – rates had to go higher, often by a ‘margin of safety’ even greater than the experienced inflation rate. Prices for goods, services and labor all spiraled higher in a daisy-chain effect that took on a life of its own. For most of the post-WW2 period inflation was low and stable – averaging just above 2% from 1952 – 1967, so this development was a major shock.
A knock-on effect was that buyers of fixed-rate Treasuries shifted their portfolios to instruments that were inflation hedges – like gold, floating rate loans, and income-producing real-estate, where rents could be indexed to the inflation rate. So even as the Treasury’s borrowing needs were expanding, the growing demand for non-fixed-rate investments crowded out US Treasury bonds, putting even greater upward pressure on interest rates.
Not surprisingly, real bond returns suffered as the higher yields were eaten up by even higher inflation. Instead, the best performing assets were gold, which delivered a 31% annual return in the 1970s and real-estate investment trusts (REITS) which generated an average annual return of 16.3% during the most inflationary period of 1974-1981 when inflation averaged 9.3%, for a +7% annual real return.
Why Stocks Fared Poorly
Compounding things for stock investors was the OPEC oil embargo of 73/74 and a heavily unionized workforce (‘big labor’) that was able to extract generous annual Cost-Of-Living Adjustments (COLA) through their collective bargaining across key industries. Typical industrial companies – which dominated the stock market in pre-Silicon-Valley days – saw their profit margins shrink as unit labor costs spiraled higher at a much faster rate than they could pass on to their customers. Labor productivity declined as their ability to squeeze workers was eroded by tight labor markets, threats of large-scale strikes, more labor-friendly union contracts, and greater environmental and labor regulations.
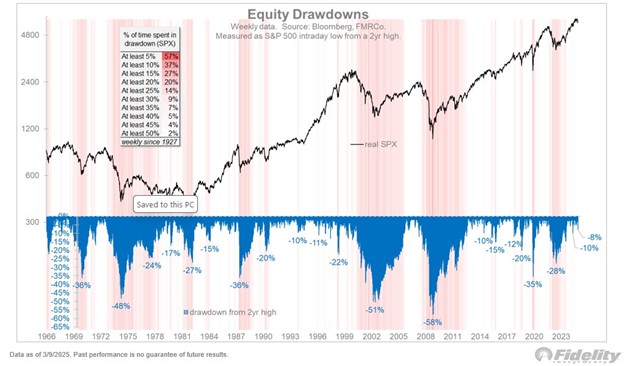
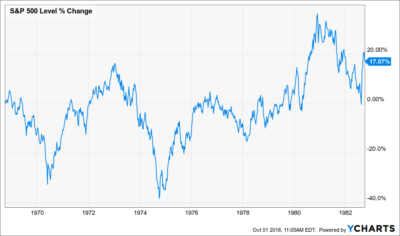
Not surprisingly, the US stock market, which lives and dies by profit growth, traded sideways during this period, with a +17% increase in the index spanning the 14 years from Oct 1, 1968 to Sep. 30 1982. This is a little over +1% a year, but in real terms the market’s return was deeply negative since annual inflation averaged 7.3% in this period. There were 3 separate bear market episodes inside this 14-year period and after the Great Depression ranks as the 2nd worse era for US Stock returns in real terms.
Lessons:
In today’s tightening labor market, we are not complacent to the risks posed by runaway inflation, and spend considerable efforts tracking its impact on companies’ labor productivity and pricing power. We view today’s labor market as having further room to tighten before wages accelerate sharply.