A significant portion of our client’s portfolios are invested in the US Bond market, so I wanted to put the current Federal debt picture in the appropriate perspective. The punch line is that we are not on the cusp of The Financial Apocalypse as some pundits will have you believe. With the help of our Bentley University summer intern – Janee Merritt – we were able to pull some fascinating historical stats on the post-WW2 evolution of our GDP and national debt.
Since 2001 we have added 11.9 Trillion in debt to fund the last 17 years’ worth of fiscal deficits (e.g. bank bailouts, middle-east wars, Affordable Care Act, Medicare, etc.) and the annual interest payment to service this debt is now 310 Billion – which amounts to 2% a year in interest paid on the 15.3 Trillion borrowed.
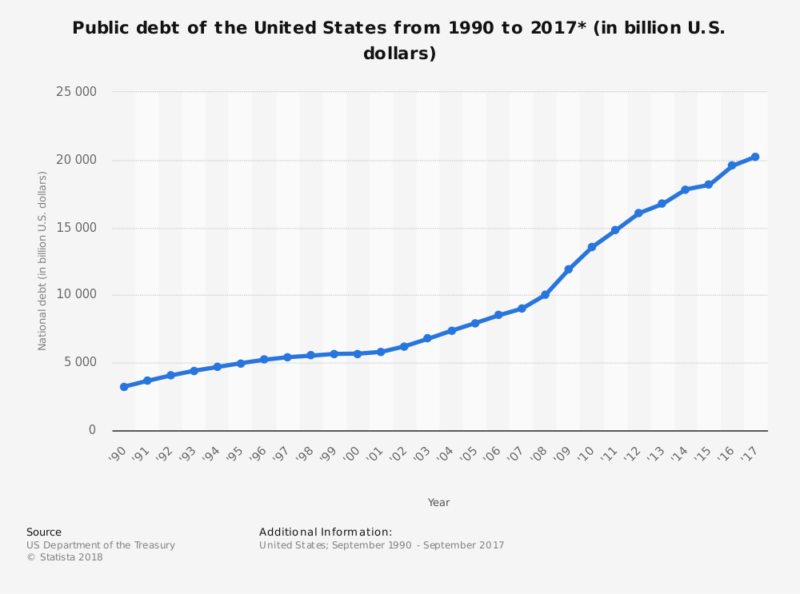
With the recent tax cut our annual deficit will be close to 300 Billion bigger per year than otherwise and will drive our US federal debt past $21 Trillion by the end of the year. The US Treasury currently has 15.3 Trillion in bonds outstanding held by the public – up from 3.4 Trillion in 2000, while the Social Security Trust fund holds another 6 Trillion in Treasuries.
But even these debt levels are only a minor threat to our bond markets as long as our economy reverts back to its long-term historical growth rate of 5-6% per year. Looking back at the last ten years this likely sounds like a stretch. However, if you look at a much longer time horizon you can draw the conclusion that this is an entirely plausible scenario.
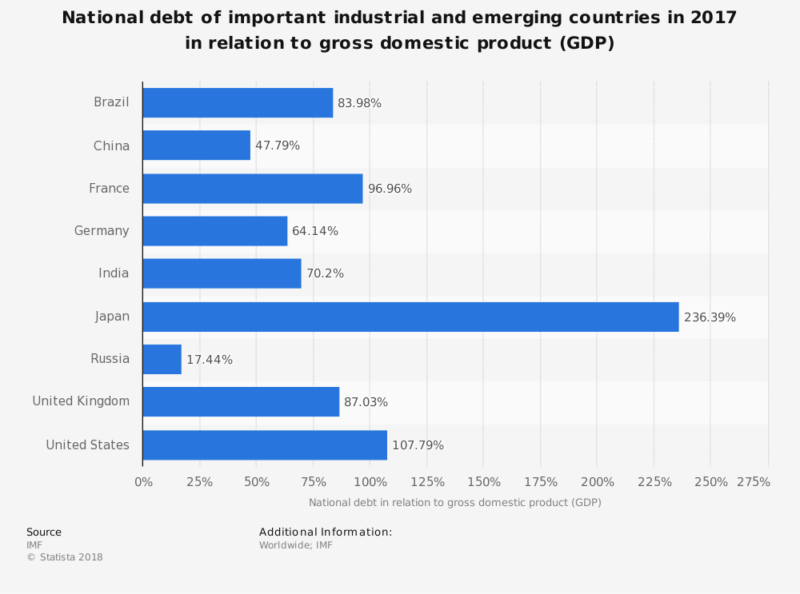
With our 2017 GDP at 20 Trillion, our national debt is now equal to 108% of GDP – better than Japan’s 238%, but slightly worse than France’s 96%, UK’s 87%, and Germany’s 64%.
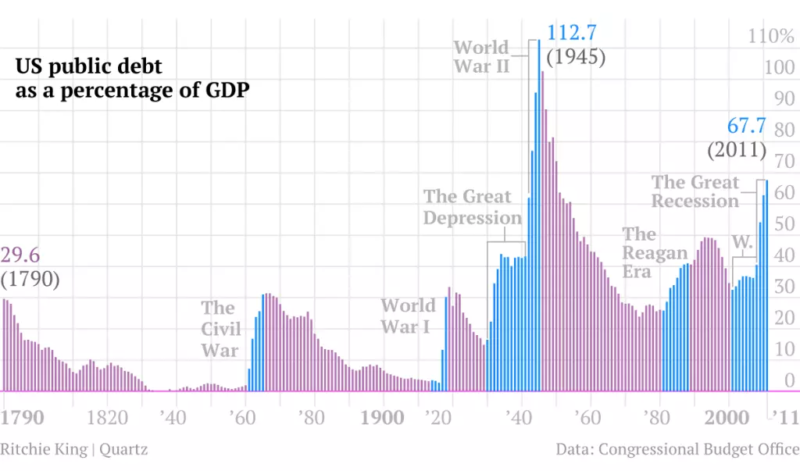
The last time our national debt reached this level was 1946 when it hit 109% of GDP… as military spending was cresting and before the post-war boom years. So while high, a debt load of 108% of GDP is by no means new territory for the US economy (or for other developed countries like Japan.)
Interestingly by 1970 the debt had increased from 242 Billion to 283 Billion, but as a % of GDP still dropped to 28%! I note that during those 24 years following WW2 it was the rare occasion when our political leaders ran a fiscal surplus…so no surprise that even that generation of politicians ran persistent deficits. In fact, the WW2-related debt was never paid down – it was rolled over (or refinanced).
We were able to lower our debt-to-income ratio so dramatically because we grew our GDP at a much faster rate (7% per year) than the US Treasury’s cost to borrow – which averaged only 3.1% in that period. Our national income (GDP) grew 4-fold from 250 Billion in 1947 to 1.07 Trillion in 1970, with real GDP growing at a rate of 4.1% per year and inflation adding another 2.75% annually. So combined, our national income grew at nearly 7% per year – easily outstripping the 3% annual borrowing cost – or interest paid on the debt – by 4% per year.
Today we are facing broadly parallel circumstances as in 1946 in that we are staring at a mountain of debt, but again with a very low carrying cost (2% annually) courtesy of the super-low interest rate environment. More importantly, in 2018 we are finally seeing nominal GDP growth exceeding 5% for the first time since 2006. For a number of reasons it is not realistic to expect 7-8% growth rates as in the 1950s and 1960s, but 5-6% rates are entirely plausible for an economy as dynamic and innovative as ours.
With this higher level of growth, if sustained, we can expect the bond market to take the recent uptick in federal borrowing in stride.
So history teaches us that high levels of debt are much less threatening if the cost to service it is below the growth rate of income (GDP). With the Treasury’s borrowing cost projected to gradually rise to 3% there is good reason to feel good about our economy’s ability to manage this debt load.
Be on the lookout for Part 2 of this walk down memory lane to see what happened to the US’ borrowing costs in the 1970s and beyond.
Sources: Treasury Dept., Office of Management & Budget, The Federal Reserve